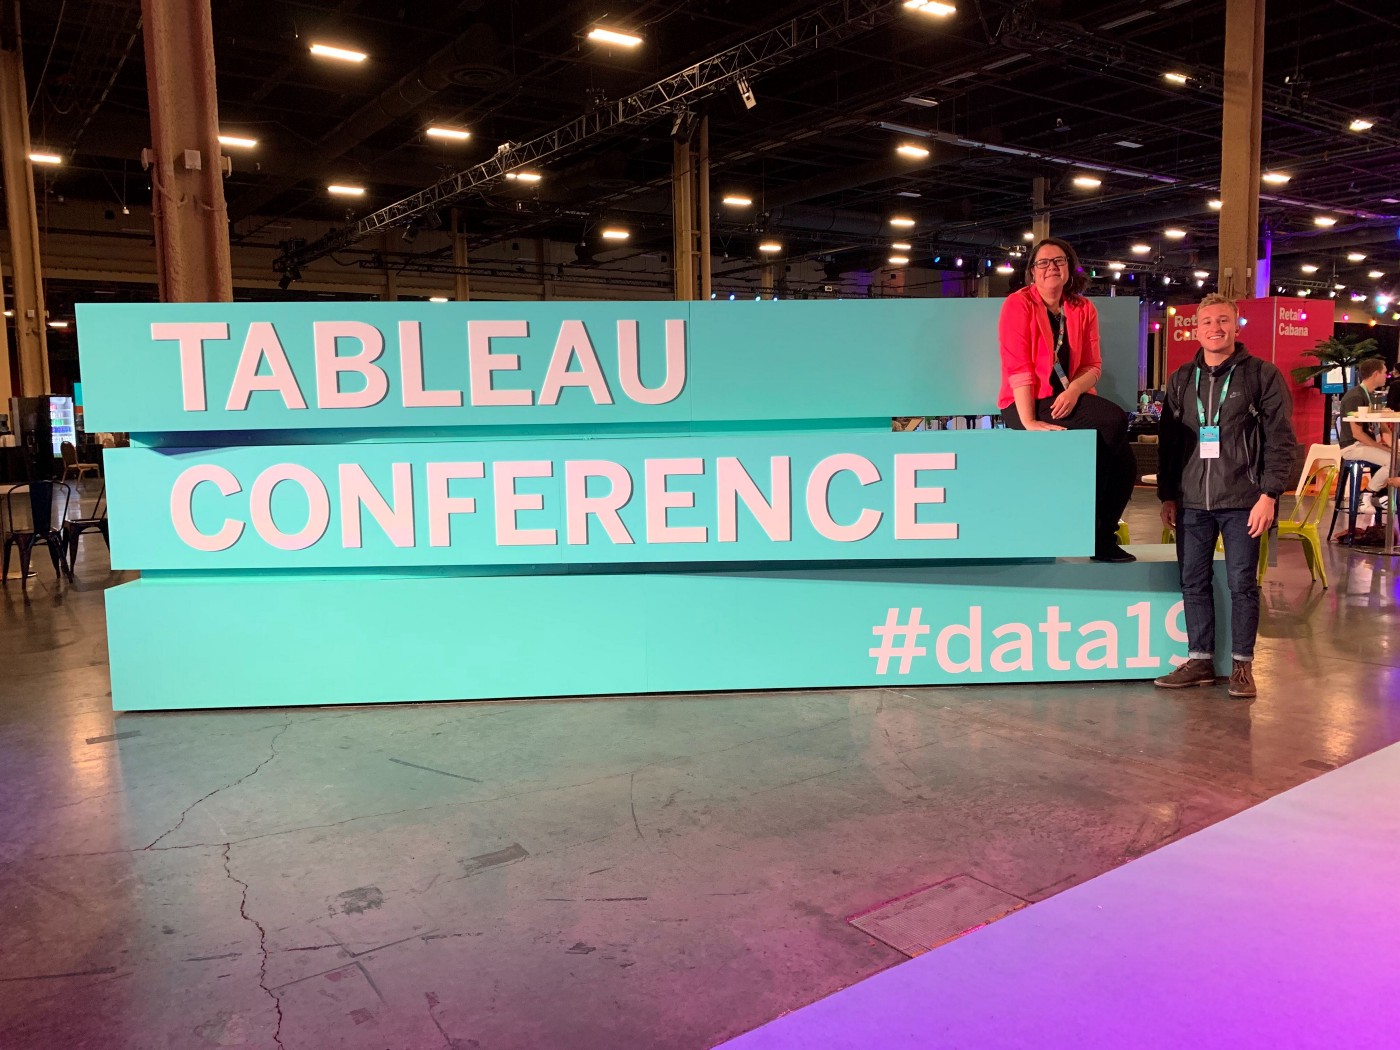
Last week, Maria Walker, Director of Data & Communication, and Ryan McEntee, Data Analyst, attended Tableau Conference in Sin City to learn, network, and place our bets on data. With the knowledge and insight we gained during our time there, we left bigger winners than ever expected.
Tableau Conference is a yearly gathering of 20,000+ data-driven individuals and organizations across all industries who come to learn, develop new skills, and connect with the biggest data community, all in one place.
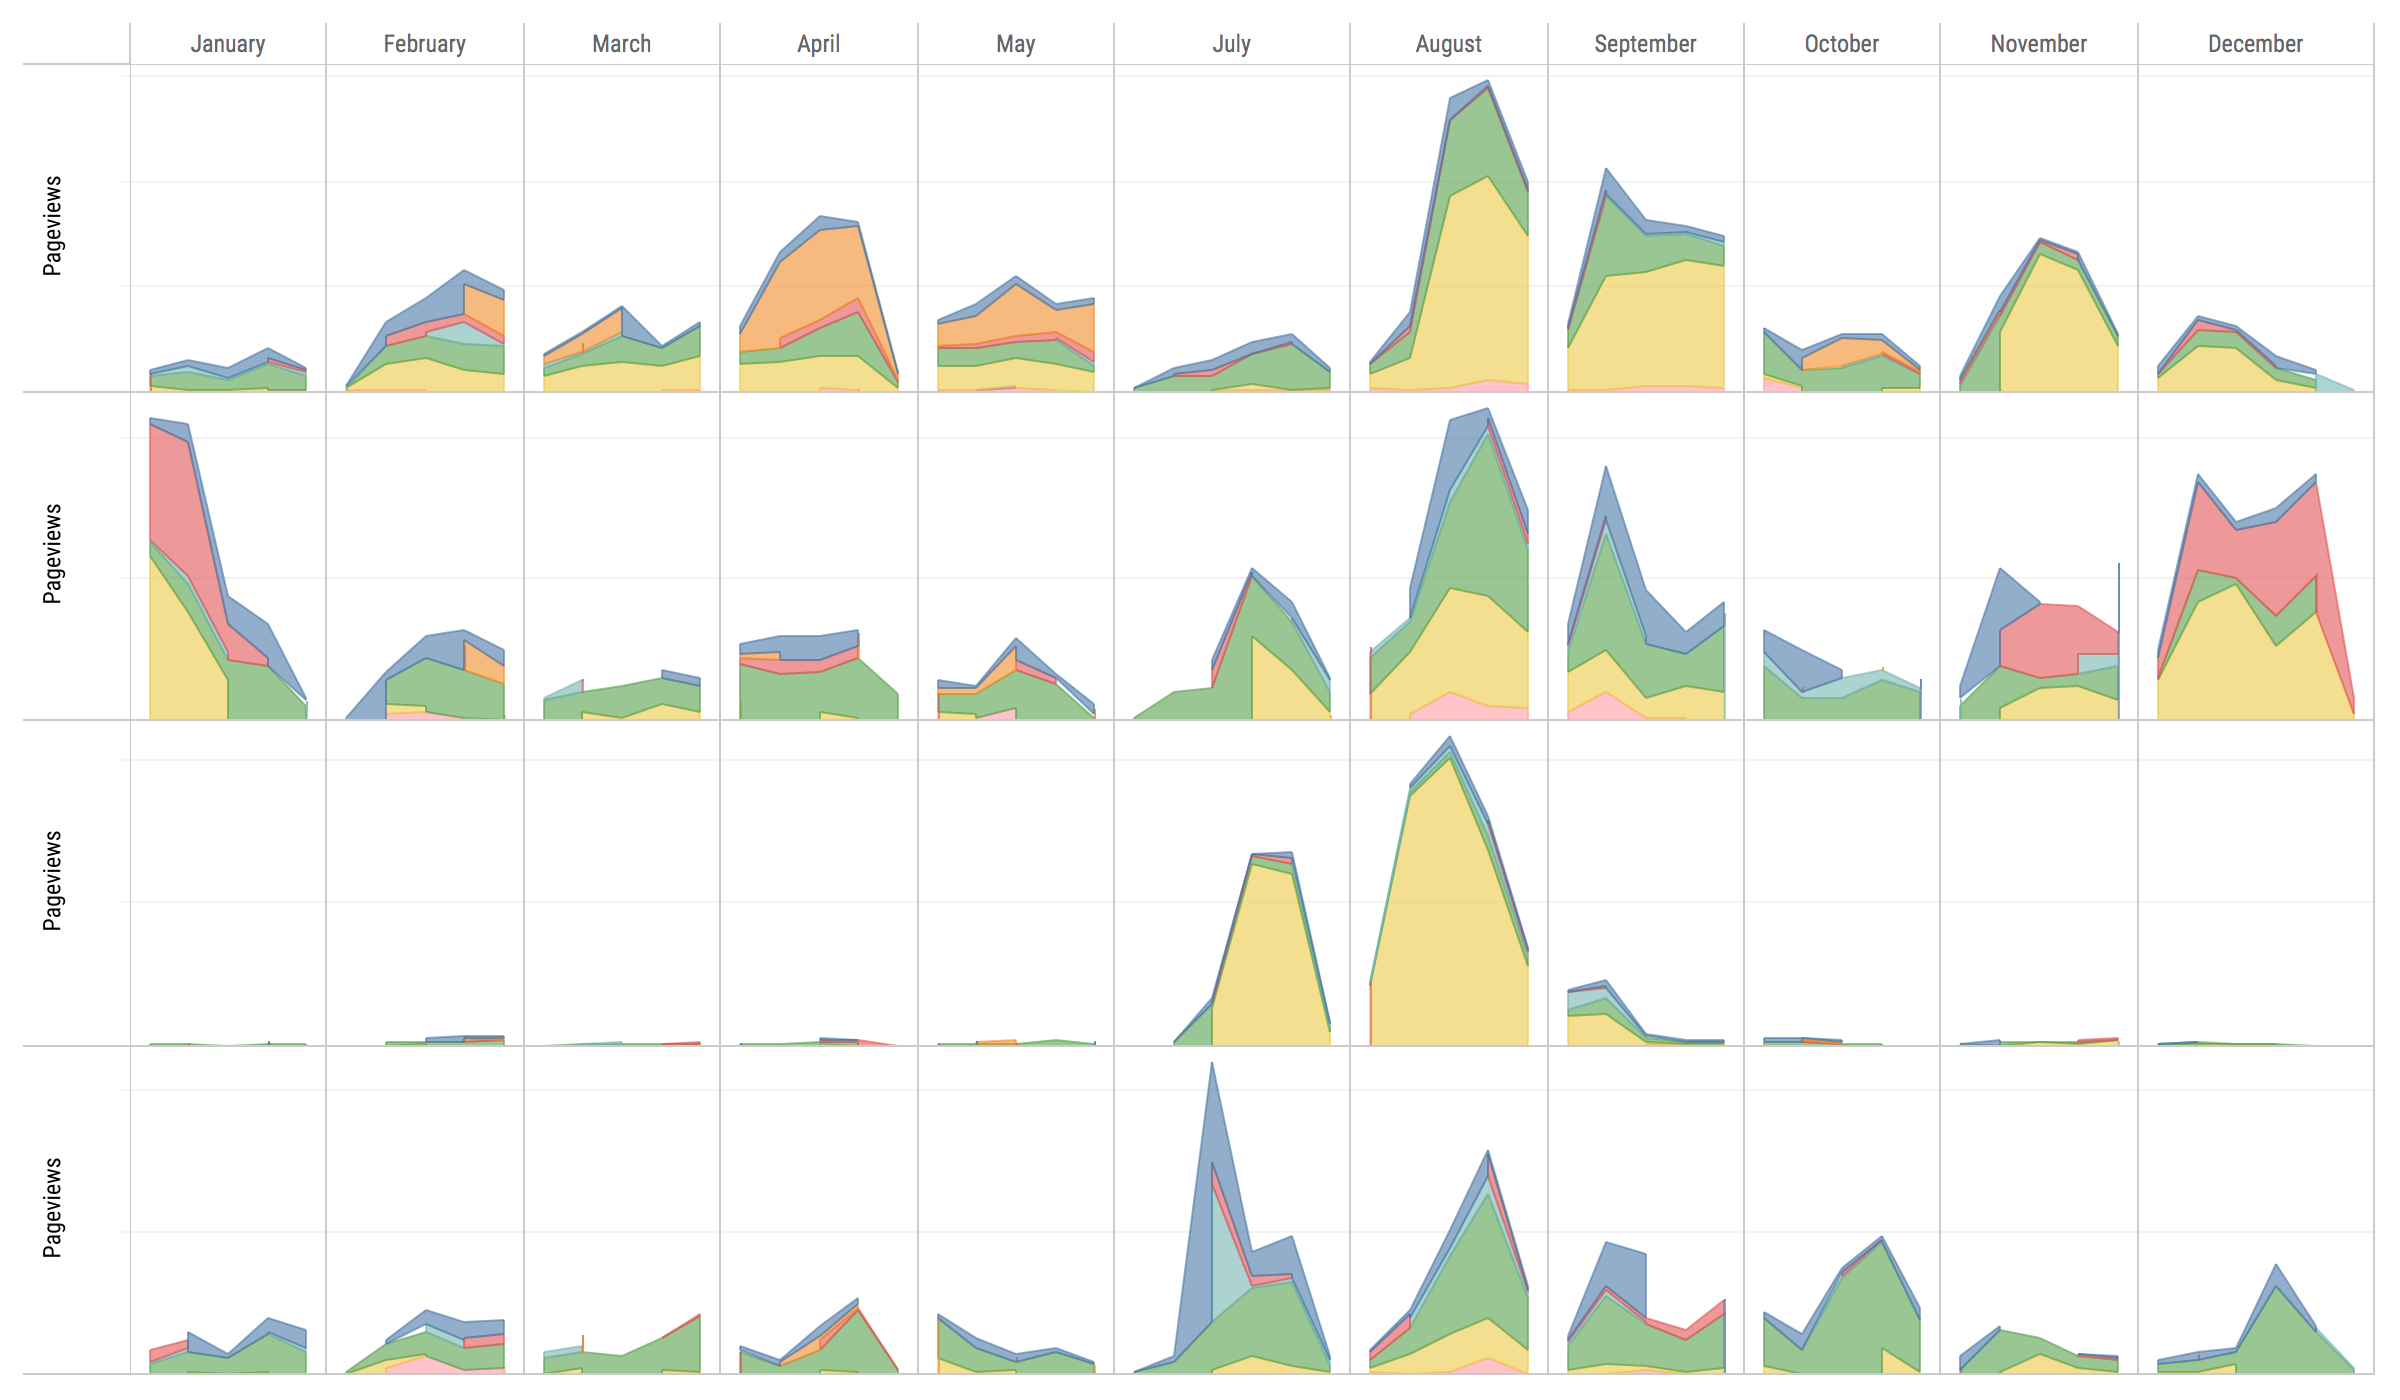
Tableau, a business intelligence software, is used to create data visualizations that allow users to see and understand their data easily. Drake Cooper uses Tableau to gather and visualize data to help the Insights & Analytics team understand the value of the advertising we push out the door and its effect on our clients’ core business KPIs. Whether we are pulling millions of rows from Google Analytics or aggregating data sources from multiple campaign platforms, Tableau helps analyze and present the data to our clients in a simple, easily digestible manner.

This was our first time at the Tableau Conference. We attended in hopes of developing our Tableau expertise further through training seminars, learning from other Tableau visualization masters, and experiencing how other organizations deal with issues and processes similar to our own.

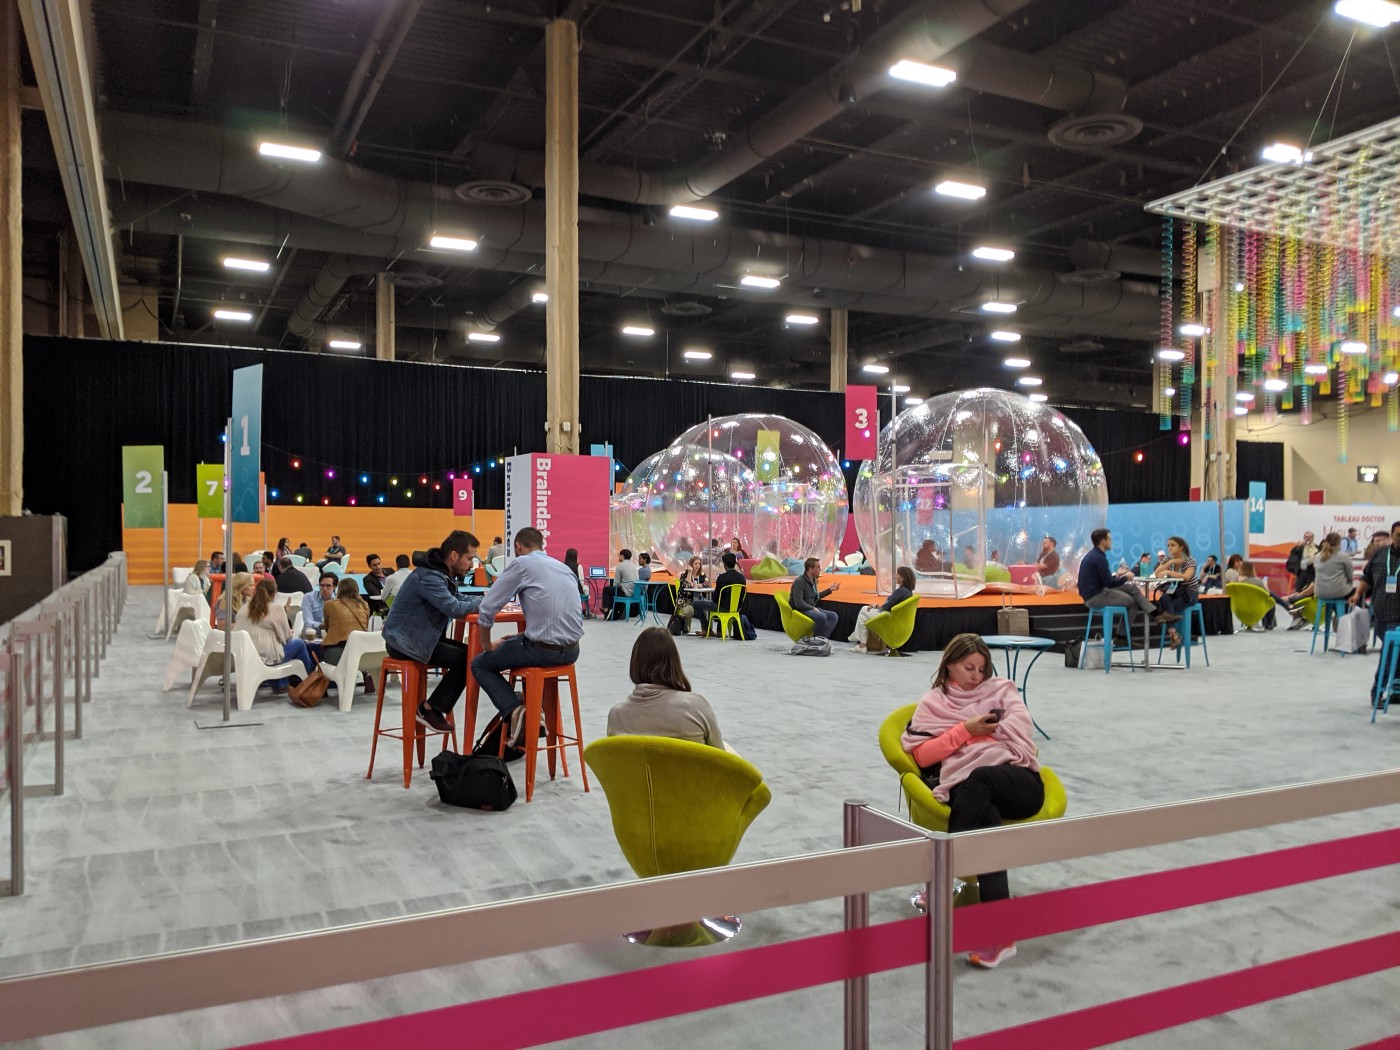
Braindates
Maria scheduled several braindates, a tool that helps like-minded people find each other at an event and have a conversation around a specific topic. One of Maria’s topics “How do you standardize reporting when every client is different?” drew six individual braindates. Despite each person coming from a different industry with varying degrees of reporting capabilities and company data cultures, it was a common problem. They shared ideas on how to improve and commiserated on the pain. Braindates were a great way to cut past small talk and get to a discussion that was meaningful to you.
Iron Viz
What might have been the absolute coolest event of the four-day conference was Iron Viz, a grueling, three-person, 20-minute competition in front of thousands to see who can build the best visualization. Think Iron Chef, but with data.
Each contestant was given the same data set (food data) and was judged on their design, analysis, and storytelling. Jump to where each contestant presented their visualizationーreally remarkable stuff.
Key Takeaways from Sessions/Speakers
Most of my four days in Vegas were consumed with attending numerous sessions featuring speakers talking about ways their organization uses Tableau, case studies, or training courses. From the U.S. Census Bureau explaining how to leverage their demographic data to Tableau employees demonstrating their use of R for causality modeling and forecasting in Tableau, there was no shortage of topics to learn about. My favorite session was Lies, Distortions, and Misrepresentations in Visualization which talked about the ways in which statistics and numbers can lie to us depending on how they are shown.

“Data Night Out”
If there’s one secret in the data community, it’s that we like to have a good time. And Tableau threw an extravagant party the last night of the conference that provided just that. Unlimited food, drinks, and fun accompanied by a live band at the nightclub and pool of the Palms Hotel. There’s no better way to close out a week of learning!
When it was all said and done, Maria and I headed back to Boise, tired. But more importantly, we left feeling inspired and eager to bring our learnings back to Drake Cooper. We can’t wait to work with our team and clients on new processes, incorporating new ways to think about data and develop new visualizations.
A Foxtrot for New Homeowners
CBH Homes tugged on the heartstrings of Idahoans with “Ain’t We Got Fun,” their latest TV spot that pairs timeless music with a bold visual style.


Our Creative Advertising Services
-

Campaign Planning™ & Strategy
Brand & Sales Strategy, Research
-

Art, Story & Experiential
Copywriting, Design, Social, Content
-

UX & Technology
UX, UI, Development, Marketing Automation
-

Findability™
SEO, SEM & Overall User Experience
-

Media Strategy, Planning & Buying
Media Strategy, Planning, Buying, Trafficking & Attribution
-

Data Insights & Analytics
Media Optimization, Trends, Forecasting, Testing
-

Photo & Video Production
Direction, Cinematography, Editing, Post